I needed to convert some numerical IP addresses to a human understandable form the other day. After writing a Groovy script to do this, I found a simpler way; use built in database functions. For example, MySQL has the function INET_NTOA() to convert IP addresses from numerical to dotted form. It is called using a select statement like this.
select INET_NTOA('123456789') as ipaddress;
This returns the value '7.91.205.21' and can be called using the "Read Database" operator.
Obviously, you would use parameters to construct the query in the general case and a loop would be needed to iterate over multiple examples. Performance might be slow for large data sets.
Sunday, 30 December 2012
Saturday, 22 December 2012
Processing value series
Value series are tricky to get working and in fact, there are some operators that I just can't make work.This is not the end of the world but to save head scratching time, here is some explanation and a process that captures the essential features of value series for reference purposes. The process finds the frequencies contained in some artificial data in two ways using value series techniques and in so doing, the results can be checked against one another to give insight into how value series work.
The first thing to say is that there are two types of value series operator. One type works on example sets, the other on example sets that have been transformed into series.
The first type is contained in the sub group "Data Transformation" and includes operators like "Differentiate" and "Integrate". These require an example set and require one attribute to be selected for processing. The operators assume the examples in the example set are an ordered time series and the attributes represent how data varies as a function of the examples.
The second type - the subject of this post - includes operators in the "Series Transformation" group. Here, the operators require a series object and these are produced using the "Process Series" operator or the "Data To Series" operator. This latter operator works in two ways; either by treating the attributes in an example as members of the series ("series_from_attributes"), or by using one particular attribute as the series variable with the ordering dictated by the example set ("series_from_examples").
One important point in the "series_from_attributes" mode is that only a single example within an example set can contribute to the series. This means that filtering of examples must happen in order to produce a series and this must happen in a loop to perform the processing on each example.
Putting all this together, the following picture shows the top level view of a process that uses both the "Process Series" and "Data To Series" operators.

The generated data is a superposition of three random sine waves with random amplitudes. The top branch shown below performs a Fourier analysis on the data and uses the "Extract Peak" operator to find the maxima of the frequency spectrum. The "Process Series" operator uses the attributes in a single example to generate the series to pass to the inner operators. In effect, this operator is iterating over all the examples in an example set.

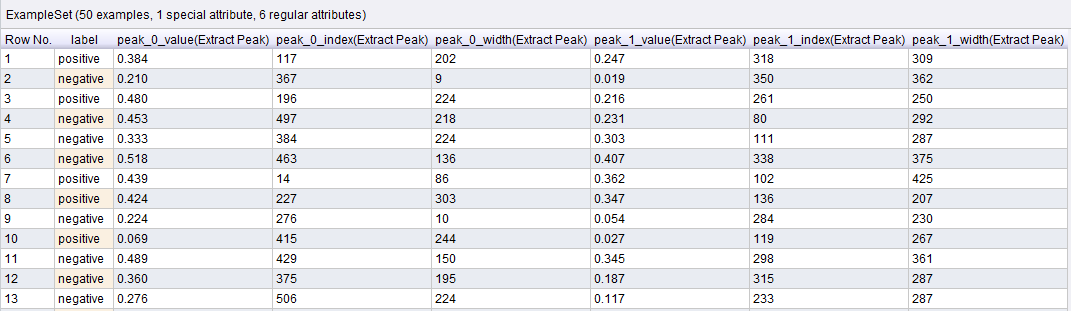
The resulting example set looks like this

As can be seen, example 1 has a maximum at 117 and a secondary peak at 318. Example 2 has a maximum at 367 and another at 350 and so on.
The lower branch processes the data using a different series approach. The picture below shows the inner operators within the "Loop Examples" operator.

The output from one iteration of the loop is fed back to the next iteration and to make this work requires the example set to be passed straight through via the "Multiply" operator. The second output is generated by the following steps
Shown below are the graphs for the first (red) and second (blue) examples. As can be seen, the peaks match what was calculated above.

In real life, you would probably not use both approaches in the same process. The "Process Series" operator is generally easier to use since it acts as a shortcut but if your data is encoded as examples then you either have to use the "Data To Series" approach or do some windowing to convert adjacent examples into attributes.
The first thing to say is that there are two types of value series operator. One type works on example sets, the other on example sets that have been transformed into series.
The first type is contained in the sub group "Data Transformation" and includes operators like "Differentiate" and "Integrate". These require an example set and require one attribute to be selected for processing. The operators assume the examples in the example set are an ordered time series and the attributes represent how data varies as a function of the examples.
The second type - the subject of this post - includes operators in the "Series Transformation" group. Here, the operators require a series object and these are produced using the "Process Series" operator or the "Data To Series" operator. This latter operator works in two ways; either by treating the attributes in an example as members of the series ("series_from_attributes"), or by using one particular attribute as the series variable with the ordering dictated by the example set ("series_from_examples").
One important point in the "series_from_attributes" mode is that only a single example within an example set can contribute to the series. This means that filtering of examples must happen in order to produce a series and this must happen in a loop to perform the processing on each example.
Putting all this together, the following picture shows the top level view of a process that uses both the "Process Series" and "Data To Series" operators.


The resulting example set looks like this
As can be seen, example 1 has a maximum at 117 and a secondary peak at 318. Example 2 has a maximum at 367 and another at 350 and so on.
The lower branch processes the data using a different series approach. The picture below shows the inner operators within the "Loop Examples" operator.

The output from one iteration of the loop is fed back to the next iteration and to make this work requires the example set to be passed straight through via the "Multiply" operator. The second output is generated by the following steps
- Filter for the single example
- Convert to series using "series_from_attributes"
- Calculate the Fourier transform
- Convert back to an example set
- Add an attribute to show the example being processed
The output is a collection which can be combined into a single example set using the "Append" operator and following a bit of light pivoting gymnastics, graphs can be drawn of the Fourier transforms for each of the examples.
Shown below are the graphs for the first (red) and second (blue) examples. As can be seen, the peaks match what was calculated above.

In real life, you would probably not use both approaches in the same process. The "Process Series" operator is generally easier to use since it acts as a shortcut but if your data is encoded as examples then you either have to use the "Data To Series" approach or do some windowing to convert adjacent examples into attributes.
Subscribe to:
Posts (Atom)